SMM January 17 News:
In 2024, due to the overall weakening of PV demand and high operating rates of crucible enterprises leading to increased inventory buildup, the purchasing willingness of crucible enterprises significantly declined compared to 2023, resulting in a rapid decline in high-purity quartz sand prices.
From January to March, domestic high-purity quartz sand prices remained stable at high levels, with prices for inner-layer high-purity quartz sand staying at 410,000 yuan/mt for an extended period. The main reason for the high prices was the panic stockpiling by module enterprises in the earlier period, which drove prices up. After the price increase, sand enterprises had sufficient orders on hand, and PV demand performed well during this period. Crucible enterprises maintained high operating rates, and sand enterprises had no plans to adjust prices.
High-Purity Quartz Sand Price Trend:
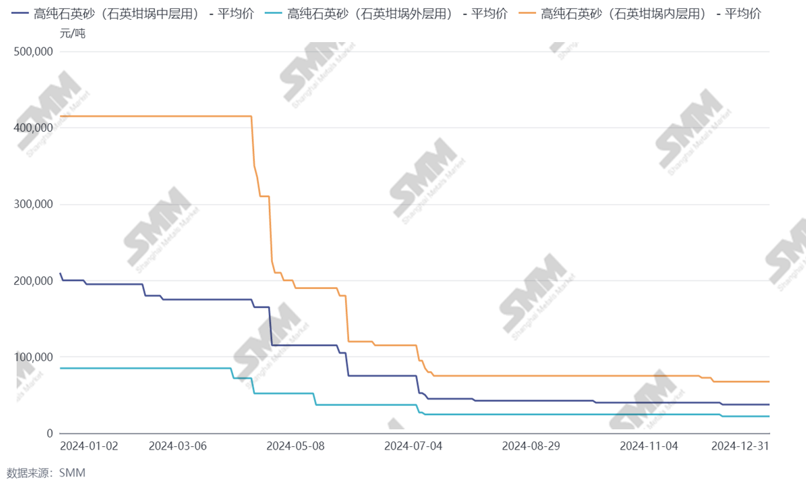

From April to June, market demand rapidly declined. Meanwhile, the production schedules of silicon wafers and crucibles began to decrease, and silicon wafer prices started to drop rapidly, exerting downward pressure on raw material enterprises. Crucible prices began to fall, and under cost pressure, crucible enterprises refrained from purchasing for several months. By the end of Q1, there were virtually no transactions in the domestic market, and quartz sand enterprises experienced consecutive months of inventory buildup. After the price of imported sand decreased, price support began to collapse. To secure orders, sand enterprises started to lower prices. Even after the price drop, the purchasing willingness of crucible enterprises remained low, leading to multiple significant price declines for domestic quartz sand, with no signs of stabilization.
Starting in July, when sand enterprises reduced their quotations to around 70,000 yuan/mt for inner-layer sand, prices began to stabilize. On one hand, the prolonged lack of purchasing over a quarter caused a slight shortage of raw materials, prompting crucible enterprises to make small-scale purchases, with trading volume increasing compared to Q2. Additionally, after a prolonged period of price declines, sand enterprises exhibited strong resistance sentiment and were less willing to adjust prices, resulting in temporarily stable price operations.
From November to December, as end-use demand further declined, silicon wafer production schedules dropped to less than 45 GW, and crucible operating rates decreased even further. Some crucible enterprises only accepted orders under tolling agreements. Major enterprises, affected by declining demand, reduced their operating rates to around 30%. Quartz sand demand significantly declined again during this period. Imported sand enterprises initiated a new round of price negotiations, resulting in further price reductions. Subsequently, crucible enterprises began to suppress domestic sand prices. Under these circumstances, domestic leading enterprises further reduced sand prices to 60,000 yuan/mt.
From January to February 2025, due to recent shortages in raw material supply among domestic leading quartz sand enterprises, production has declined for several consecutive months, and future supply is expected to decrease further. Therefore, in January, sand enterprises began to slightly increase their quotations. However, as of now, no transactions have been made, and crucible enterprises are primarily engaged in price negotiations.
![[SMM PV News] Armenia Hits 1.1 GW Solar Capacity,](https://imgqn.smm.cn/usercenter/qQwIB20251217171741.jpg)
![Spot Market and Domestic Inventory Brief Review (February 5, 2026) [SMM Silver Market Weekly Review]](https://imgqn.smm.cn/usercenter/tSwaX20251217171735.jpg)